Cache lab how to
Part A Build a Cache Simulator
It is not an acutal cache, it doesn’t store any data, it only simulate the working flow of the real cache
- use
getopt()inunistd.hto get parse arguments -
fscanfis also very useful in this part - use
mallocandfreeto manage memory
Part B Matrix Transpose
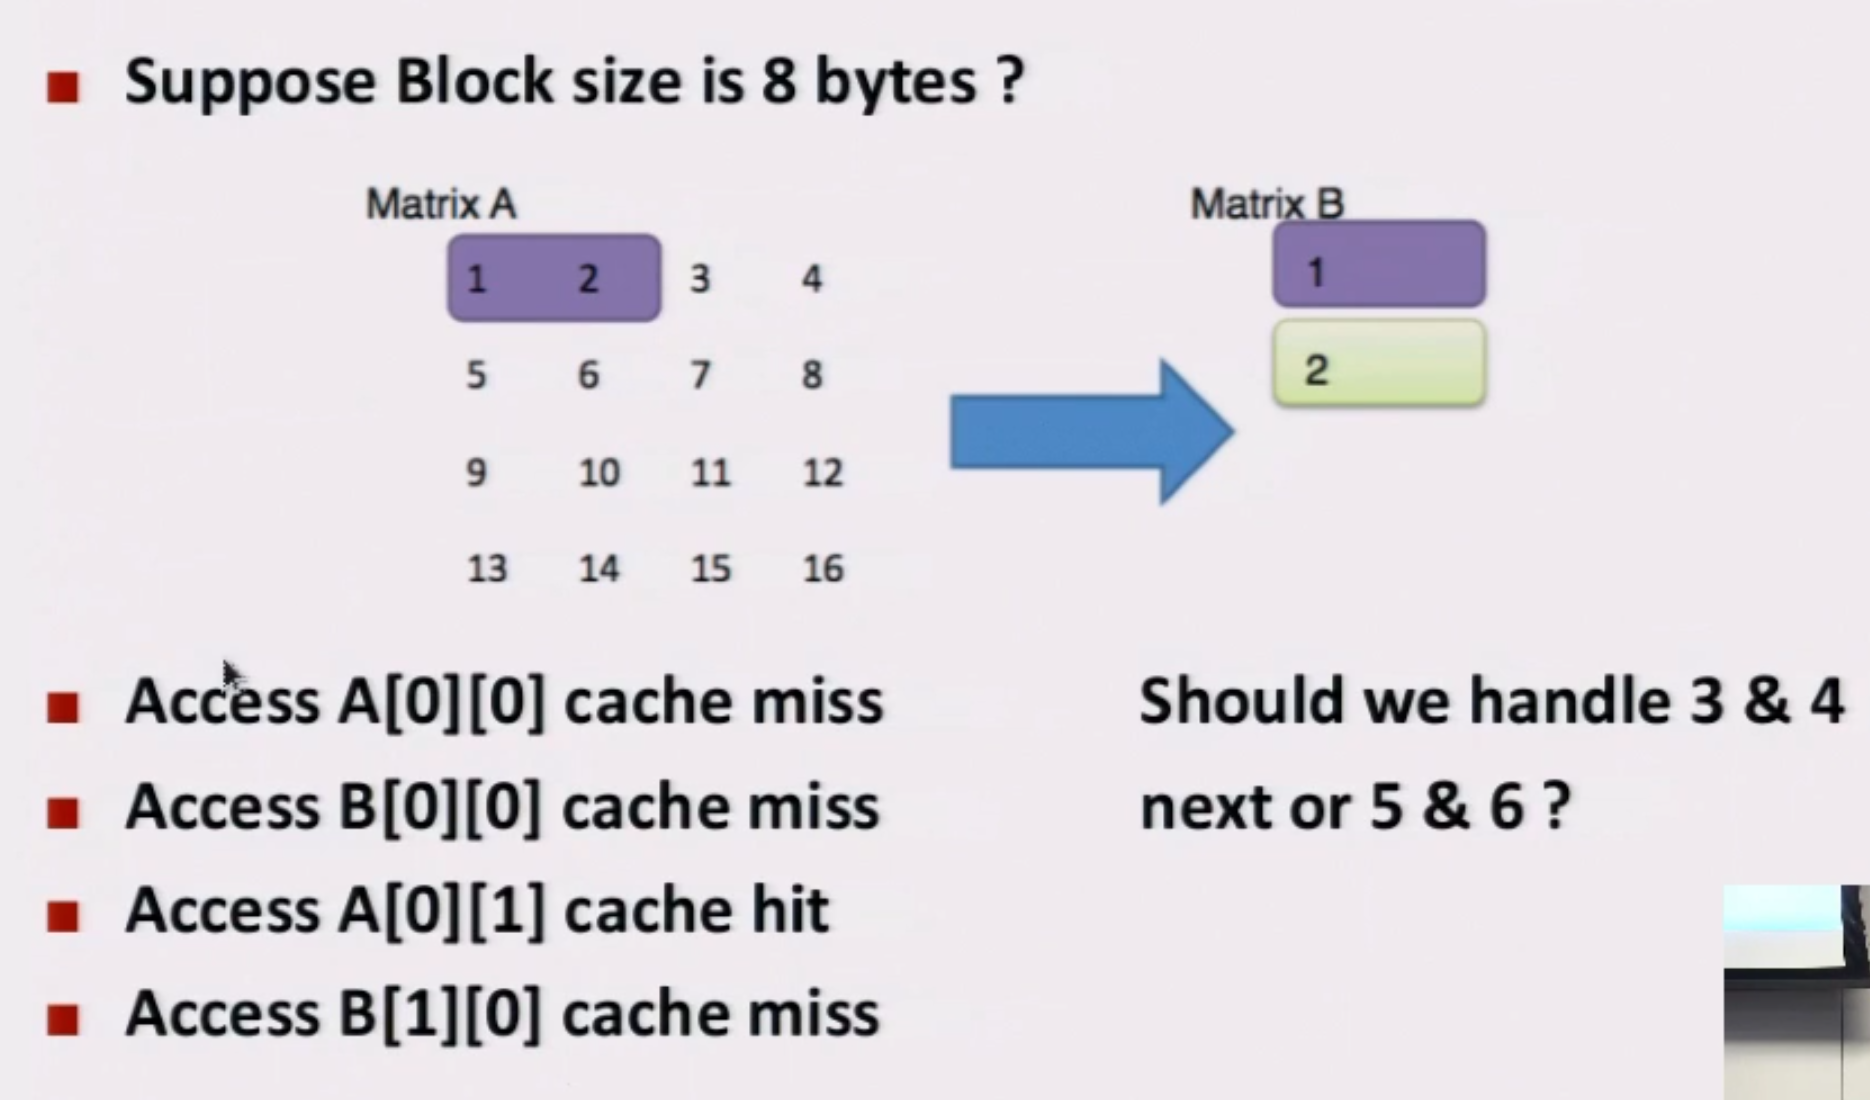
Use blocking techique, dividing matrix into submatrix
blocking works or not has a lot to do with the cache size !!!
The cache block size will decide the block size
Transpose example

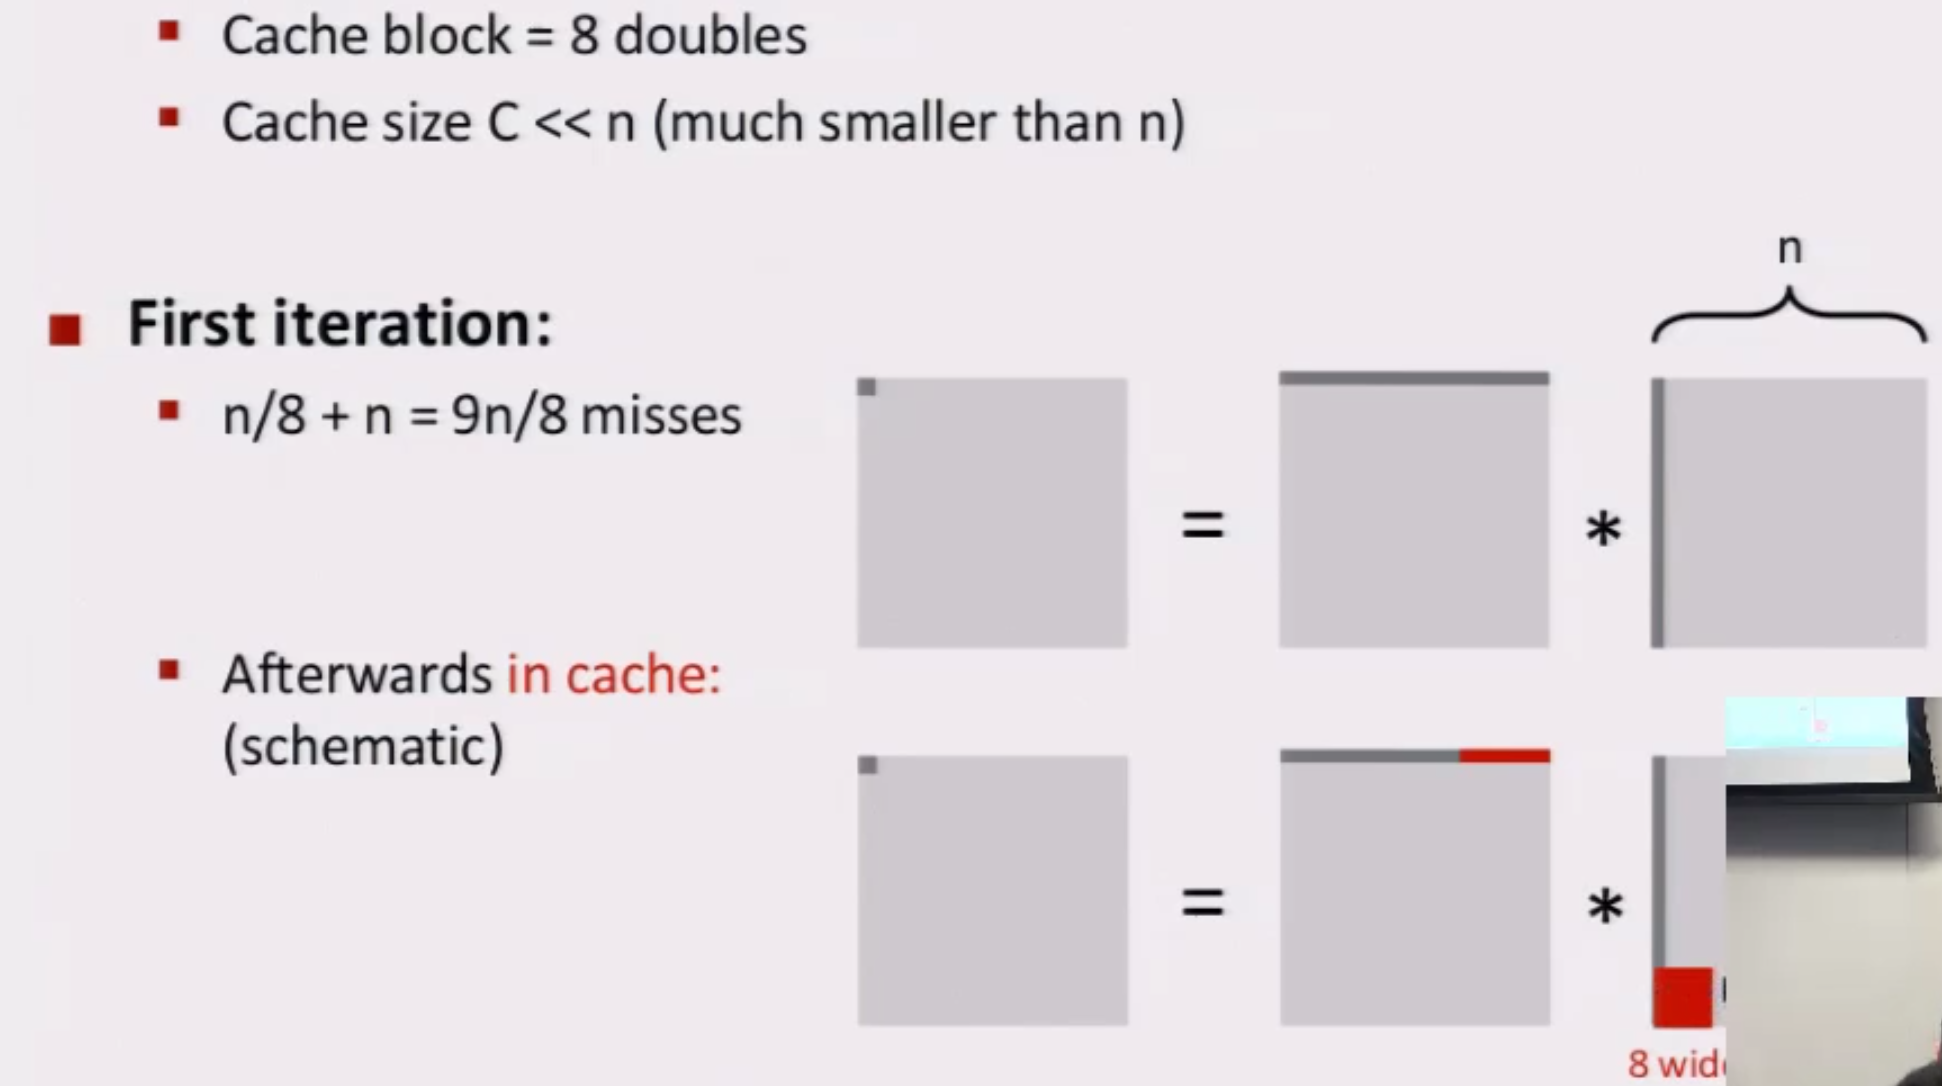
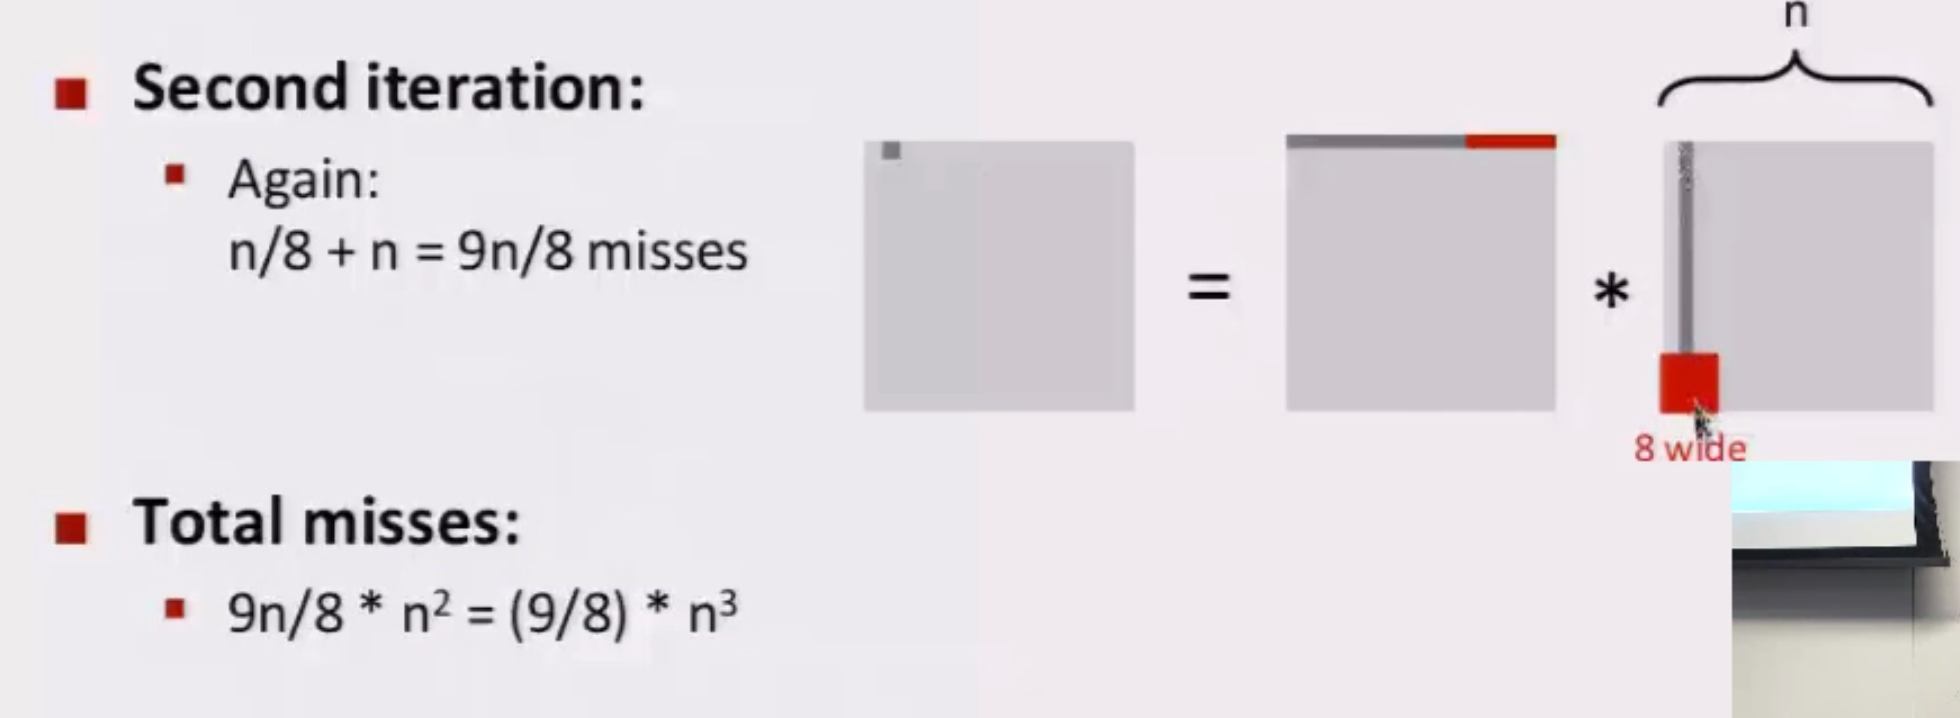
Multiplication example
Bad case(no blocking):


Read the writeup
1 | $ tar xvf cachelab-handout.tar |
You will be modifying two files: csim.c and trans.c.
Reference Trace Files
The traces subdirectory of the handout directory contains a collection of reference trace files that we will use to evaluate the correctness of the cache simulator you write in Part A.
The trace files are generated by a Linux program called valgrind
Output format : [space]operation address,size
The operation field denotes the type of memory access: I denotes an instruction load, L a data load, S a data store, and M a data modify (i.e., a data load followed by a data store). There is never a space before each I. There is always a space before each M, L, and S
Part A: Writing a Cache Simulator
In Part A you will write a cache simulator in csim.c that takes a valgrind memory trace as input, simulates the hit/miss behavior of a cache memory on this trace, and outputs the total number of hits, misses, and evictions.
Your job for Part A is to fill in the
csim.cfile so that it takes the same command line arguments and produces the identical output as the reference simulator. Notice that this file is almost completely empty. You’ll need to write it from scratch.For this lab, we are interested only in data cache performance, so your simulator should ignore all instruction cache accesses (lines starting with “I”). Recall that valgrind always puts “I” in the first column (with no preceding space), and “M”, “L”, and “S” in the second column (with a preceding space). This may help you parse the trace.
To receive credit for Part A, you must call the function
printSummary, with the total number of hits, misses, and evictions, at the end of your main function:printSummary(hit_count, miss_count, eviction_count);Your csim.c file must compile without warnings in order to receive credit.
Your simulator must work correctly for arbitrary s, E, and b. This means that you will need to allocate storage for your simulator’s data structures using the malloc function. Type “man malloc” for information about this function.
For this lab, we are interested only in data cache performance, so your simulator should ignore all instruction cache accesses (lines starting with “I”). Recall that valgrind always puts “I” in the first column (with no preceding space), and “M”, “L”, and “S” in the second column (with a preceding space). This may help you parse the trace.
To receive credit for Part A, you must call the function
printSummarywith the total number of hits, misses, and evictions, at the end of your main function:printSummary(hit_count, miss_count, eviction_count);For this this lab, you should assume that memory accesses are aligned properly, such that a single memory access never crosses block boundaries. By making this assumption, you can ignore the request sizes in the valgrind traces.
Part B: Optimizing Matrix Transpose
In Part B you will write a transpose function in trans.c that causes as few cache misses as possible.
You are allowed to define at most 12 local variables of type int per transpose function.
Your code only needs to be correct for these three cases(
32×32,64×64,61×67) and you can optimize it specifically for these three cases. In particular, it is perfectly OK for your function to explicitly check for the input sizes and implement separate code optimized for each case.The
test-transprogram saves the trace for functioniin filetrace.fi.They are invaluable debugging tools that can help you understand exactly where the hits and misses for each transpose function are coming from. To debug a particular function, simply run its trace through the reference simulator with the verbose option:./csim-ref -v -s 5 -E 1 -b 5 -t trace.f0Since your transpose function is being evaluated on a direct-mapped cache, conflict misses are a potential problem
Evaluation
Part A
1 | $ ./csim -s 1 -E 1 -b 1 -t traces/yi2.trace |
1 | $ make |
Part B
1 | /* Header comment */ |
1 | $ make |
All in one
1 | $ ./driver.py |
Tips
1 | //headers for getopt |
Since your transpose function is being evaluated on a direct-mapped cache, conflict misses are a potential problem. Think about the potential for conflict misses in your code, especially along the diagonal. Try to think of access patterns that will decrease the number of these conflict misses.
My solution
Part A
When manipulating values in memory,one should Never create local variables !!! Create Pointers !!!
Debug python script
1 | from termcolor import cprint |
Print array in gdb
If source code is avaliable and you are debugging programing works, vanilla gdb is better than pwndbg
1 | $ p *arrayname@arraylen |
Source code
1 |
|
Evaluation
1 | $ make clean ; make ; |